It is observed that repeated loading and unloading weakens objects over time even when the induced stresses are considerably less than the allowable stress limits. This phenomenon is known as fatigue. Each cycle of stress fluctuation weakens the object to some extent. After a number of cycles, the object becomes so weak that it fails. Fatigue is the prime cause of the failure of many objects, especially those made of metals. This is why fatigue analysis is so important for any mechanical component.
Simulation Fatigue Analysis in SOLIDWORKS
Fatigue isn’t something that happens only at the point of highest stress in the material. It happens everywhere. If the load changes as the component moves through the load cycle, there may be multiple peak stress areas. Furthermore, the failure may happen in an area with somewhat high stresses in every load event, but never the peak stress.
How do I complete a Simulation Fatigue Analysis in SOLIDWORKS Simulation Professional? A Fatigue study leverages existing analyses as Load Events. To start a Fatigue analysis typically a linear static analysis, or multiple linear static analyses are utilized as base studies.
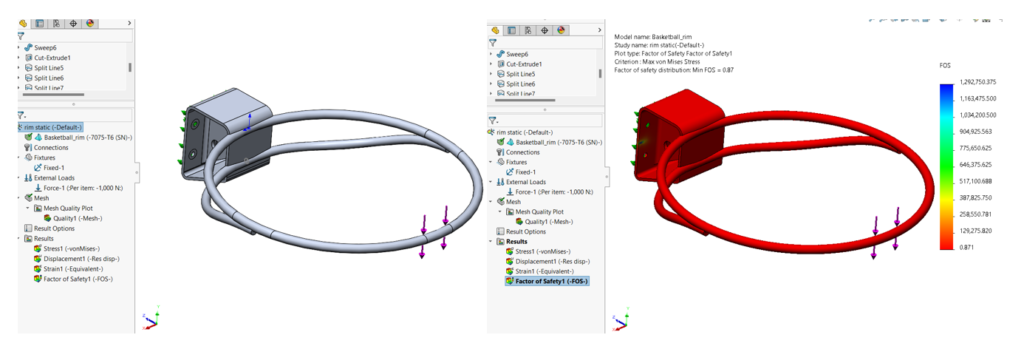
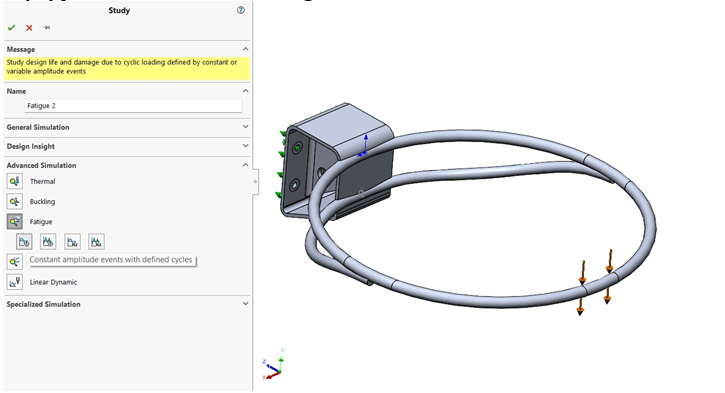
Once the base study or studies are complete the next step is to start the Fatigue analysis. Start by selecting Fatigue for the study type. Select the type of Fatigue analysis you wish to complete. The choices are Constant Amplitude, Variable Amplitude, Harmonic, or Random Vibration. A Constant Amplitude study type was chosen for this blog.
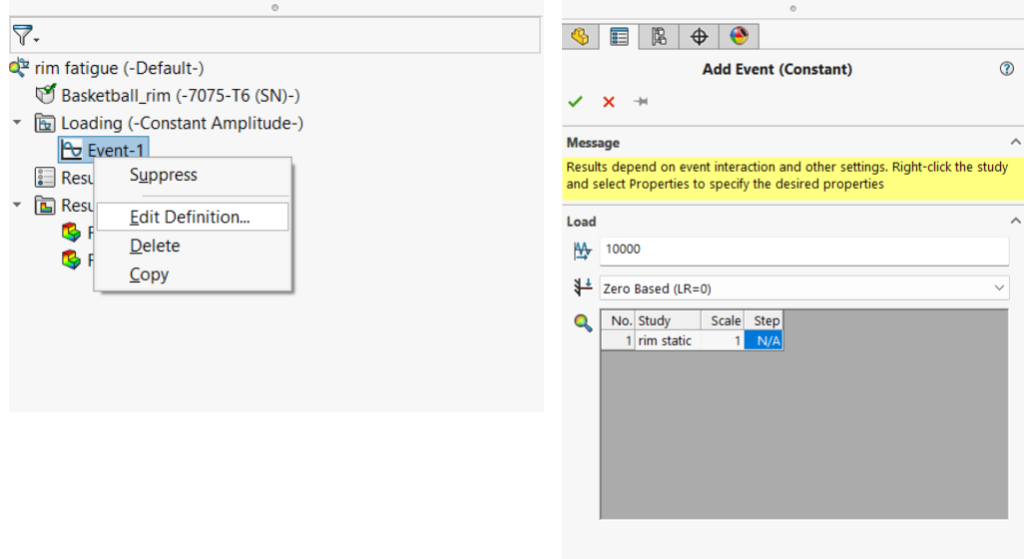
The Fatigue study opens and the first thing to apply is the Event, or Events. The Event is how the Fatigue Study links to the base study. Multiple Events can be combined to understand cumulative damage. Specify the number of cycles for the event. Choose if you want to apply the Event as Fully Reversible, Zero Based, Load Ratio, or Find Cycle Peaks.
Apply material: If material properties chosen in the static studies will be transferred to the fatigue study. If the existing material data does not have a fatigue curve, we need to enter a curve based on data points.
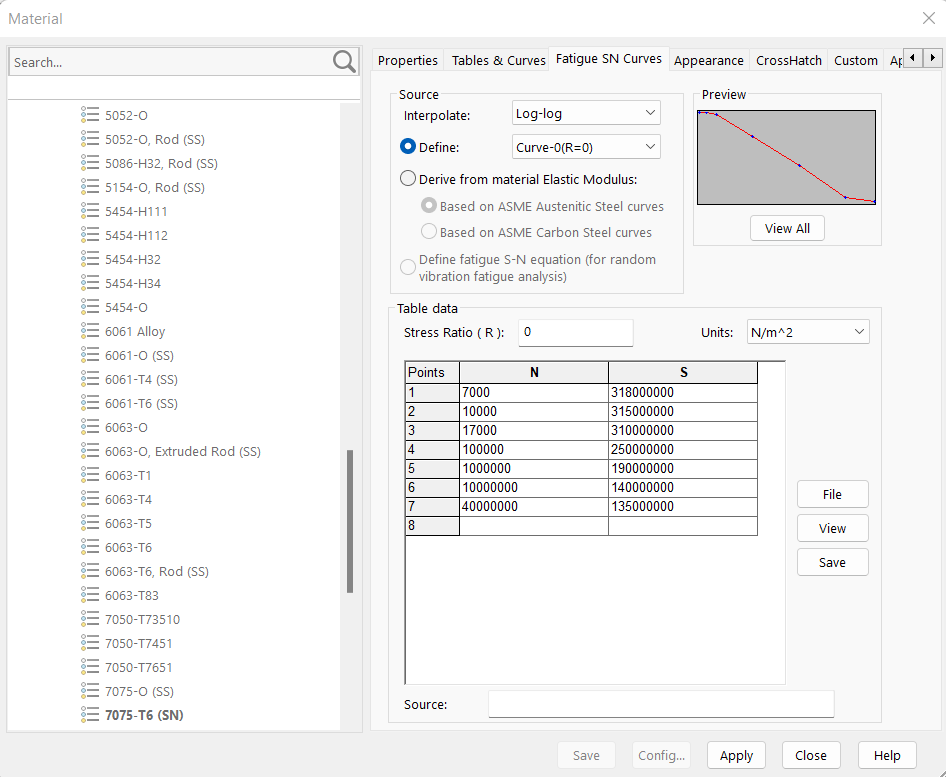
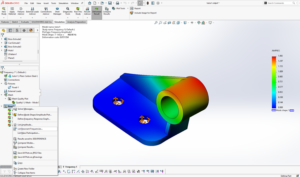
Run the study and review the results. For Single Event Fatigue studies, a Life Expectancy plot is available. Resulting damage and life plots are shown below. A life plot indicates the maximum number of cycles at the given loading level before the fatigue failure occurs.
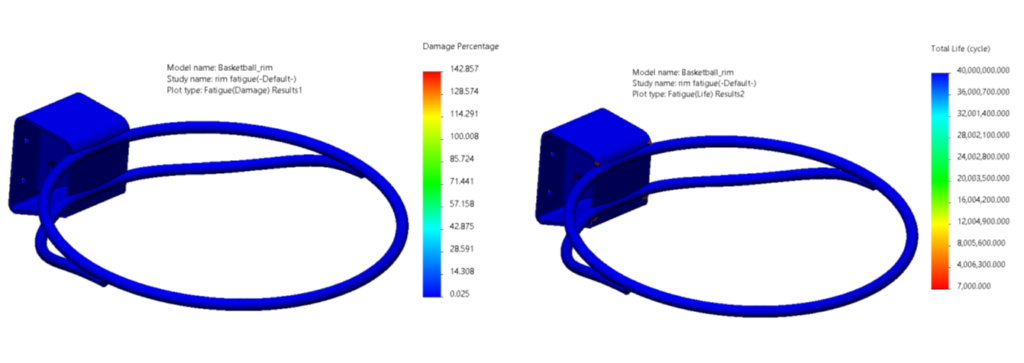
Therefore, a damage plot indicates the percentage of product life that has been consumed by the applied event. The life plot shows the number of cycles of the event that would cause fatigue failure at every location on the product. And with your fatigue analysis complete, you will have a much higher confidence in your design knowing that it will last for as long as you intend it to. Now go make your products better with SOLIDWORKS Simulation!
- -By
- Shamil K U
- Application Engineer – CAE

