Create Your Very Own Dashboard On the 3DEXPERIENCE Platform
In today’s modern business, there is a lack of collaboration because of a scattered team in an organization, making employee engagement across departments challenging, as well as obtaining design data securely and maintaining control over company information. In this blog I am going to explain you how a Dashboard driven by Collaborative Business Innovator help you optimize your processes in 3DEXPERIENCE Platform.
The 3DEXPERIENCE Collaborative Business Innovator role allows you and your design teams to seamlessly collaborate on, analyze, and evaluate SOLIDWORKS designs, as well as provide the supporting apps and services that effectively connect all users in the value stream 3DExperience is a Business Experience platform providing software solutions for Engineering, Marketing, Procurement, Manufacturing.
The 3DDashboard provides the real-time information required to keep track of everything important to a company. Dashboards allow you to organize your workspace in a flexible and dynamic way. Users can see everything that is going on in an organization in one dashboard Every platform user can establish a dashboard for personal, business, and engineering projects that collects all relevant information in one place, such as web resources, personal files, and 3DEXPERIENCE applications, to make decision-making easier.
SOLIDWORKS users can use Collaborative Business Innovator to create dashboards where users can create social communities and securely share data, and connect people, knowledge, and information in one place. In this scenario, I’ve created a sample dashboard with many tabs, where each tab displays a separate workflow process within the project and each of which has a different app that lets users acquire accurate project information in a single dashboard.
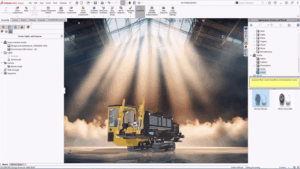
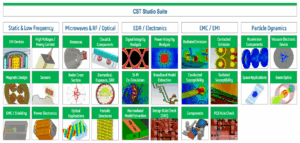
A typical 3DDashboard is shown below, which offers a completely customizable online representation of the critical information needed to drive your design projects forward.
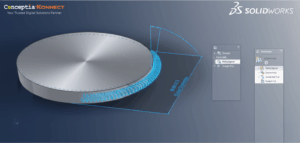
Adding tabs on the 3DEXPERIENCE Dashboard is a simple task. Click on 3D Compass and select Collaborative Business Innovator, and all the App will be displayed. Simply drag and drop the App onto the tabs.
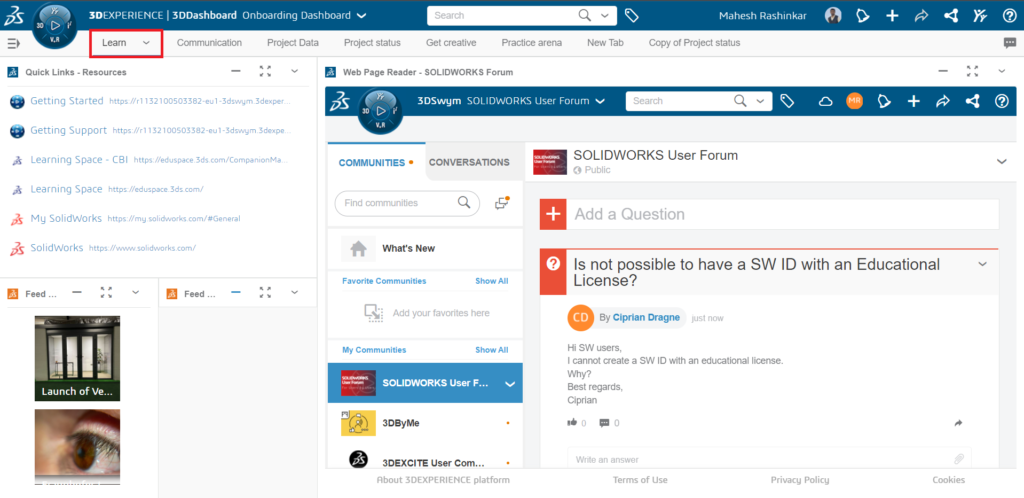
Learn
This learn tab gives access to learn different topics by adding specific Applications.
Quick Links App where user can store all of your frequently used links in one convenient place.
Feed Reader App which allows user to subscribe to RSS Feeds to keep update of latest information with respect to industry domain and Technology.
Webpage Reader where you can add an entirely interactive live view of a webpage to your dashboards.
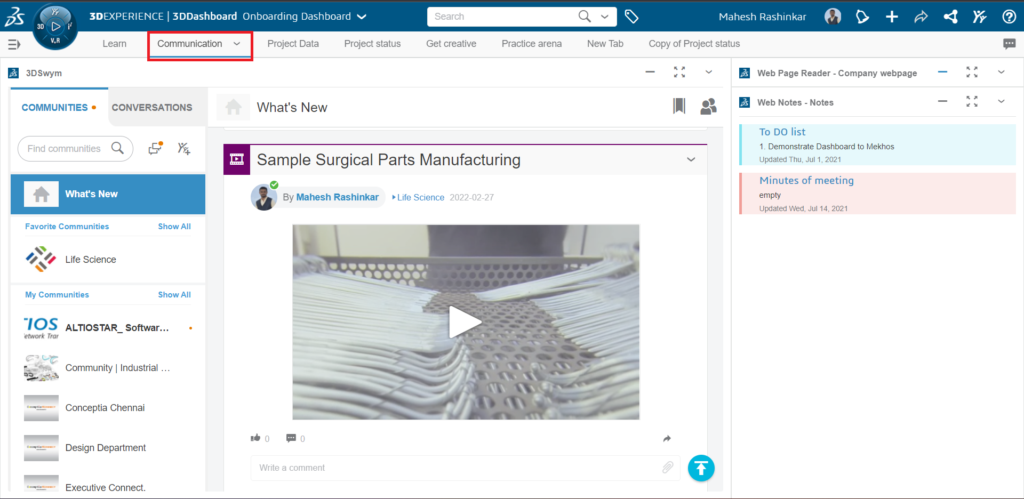
Communication
This Tab consists of Apps which allow Each user in an organization to collaborate and share information.
3DSwym application which is a hub of 3DEXPERIENCE Platform and portal to internal communication were users can create communities and easily collaborate, upload ideas, Question Postings, areas of interest and surveys which enables you to quickly get qualitative data in order to better understand options and improve decision-making.
Web Notes where user can create and manage meeting notes, ideation notes, project notes, and everything else you need.
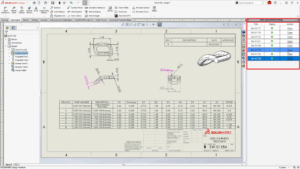
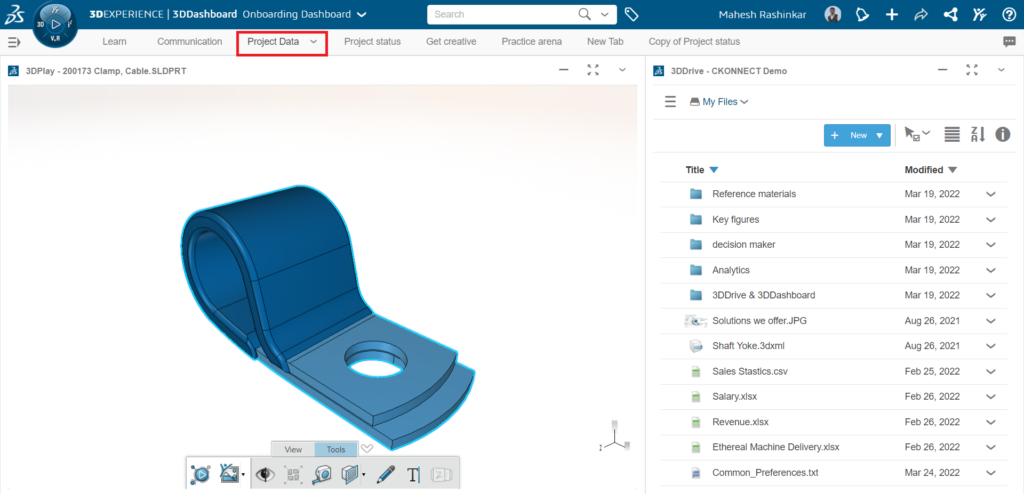
Project Data
This tab will serve as a link between the 3D model and any supporting documentation in one convenient location.
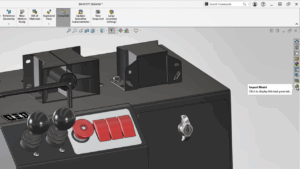
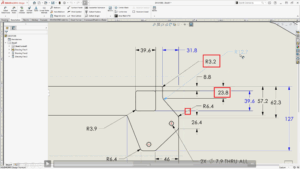
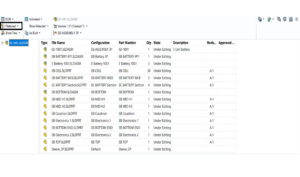
The 3DPlay App on the 3DEXPERIENCE platform works as a file viewer which allows you to view 3D Models, Image files, PDF’s and many more file types. Also, you can take the measurements of 3D Model, if you see problem with file and want to ask any question with respect to 3D Model you can use Mark-up tools within in 3D Play app which has ability to type notes, as well as draw on the screen with a mouse, pen, or finger You may use 3DPlay to mark up an image, a pdf, a drawing, and much more than simply 3D Models because of the variety of file formats it can examine
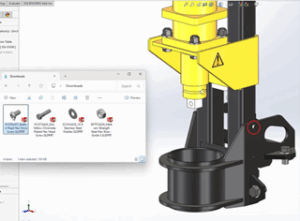
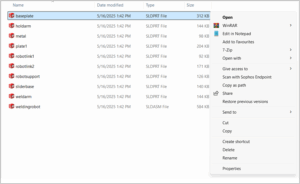
Everyone who uses 3DEXPERIENCE now has access to 3DDrive, a secure cloud storage service. Other storage solutions are included in other roles, but this one allows everyone to save crucial project files directly to the cloud. You can even use it to synchronize files from your hard drive to the cloud, giving you enhanced data security and accessibility across several devices. It also functions as a cloud-based file sharing service, allowing you to share copies of files or give others access to the original.
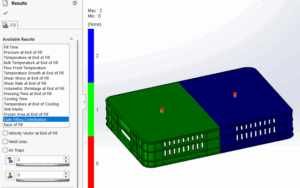
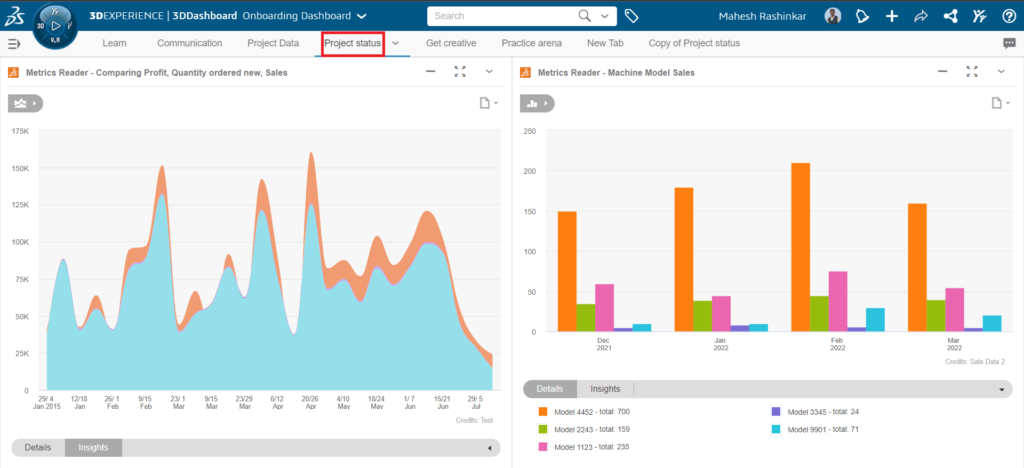
Project Status
This tab enables the user to view the derived data as a graphical representation.
Use Metrics Reader to create charts where input data and visual representations in the form of various graph types such as Column Chart, Pie chart. We can easily track the company data or any other metric.
The above said Dashboard with Tabs like Learn, Communication, Project Data and Project Status which include different apps is a sample and simple Dashboard created by us. Similarly, you can customize your dashboard based on your organization requirement. When you have the Collaborative Business Innovator on your 3DEXPERIENCE Dashboard that makes your workflow simpler and smooth.
- -By
- Mahesh Rashinkar
- Application Engineer